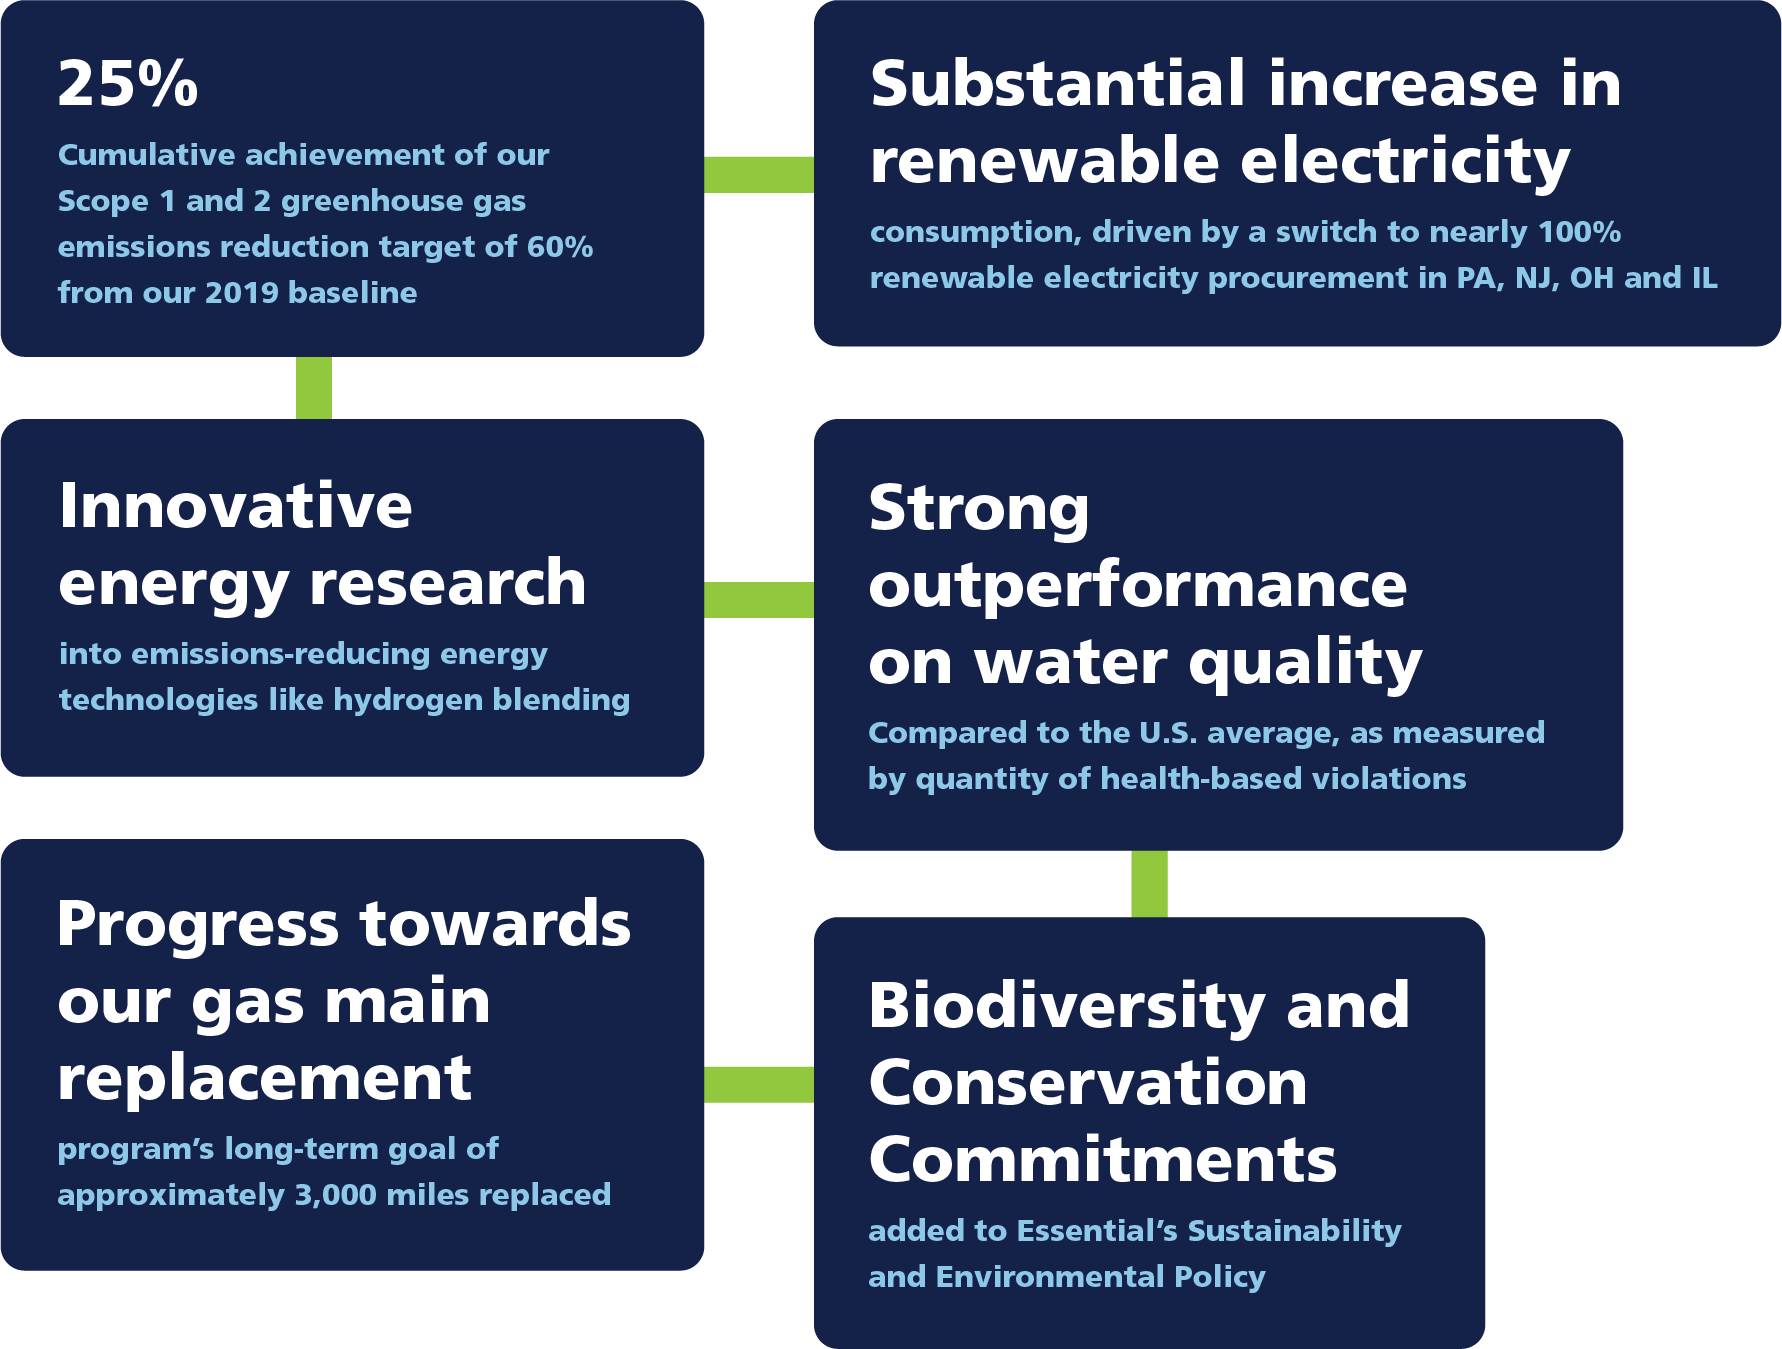
Please click on the tiles below for more information about Essential’s targeted environmental initiatives.
Download the ReportAt Essential, our missions to sustain life and improve economic prosperity by safely and reliably delivering Earth’s most essential resources to our customers and communities fuels everything we do. We have taken these commitments seriously for more than 135 years.
Fresh water is a limited resource on our planet, and we need to manage it responsibly.
Through conservation and stewardship, Essential helps to safeguard water security for future generations. Essential also strives to operate a safe, resilient gas distribution system that provides affordable and reliable energy to our customers. Across our operations, we have participated in environmental conservation and stewardship with many community partners to preserve and protect sensitive lands, plant thousands of trees, manage invasive species, reintroduce and reestablish native species and protect habitats. We have also released an ambitious emissions reduction target with concrete actions outlined to achieve this goal.
Our Sustainability and Environmental Policy outlines the ways we apply our mission throughout our environmental profile. Our actions reflect the values that permeate our team and operations around the country. We ensure environmental stewardship remains a priority for company management by factoring several benchmarks into executive compensation. This means water compliance, wastewater compliance, gas pipeline replacement and minimizing gas leaks all contribute an equal weighting to executive leadership.
In this report, we expand on our commitment to present our stakeholders with some of the most detailed and transparent disclosures in the utilities industry. Whether we are speaking about water quality, gas system reliability, greenhouse gas emissions or our waste program, we aim to provide rigor around both quantitative disclosure and qualitative explanations and context.
As a large and diversified utility, Essential’s strong environmental management system is critical to our operations.
Our Environmental, Health and Safety management program identifies, prioritizes, communicates, addresses, mitigates and manages risks to ensure safe and reliable service for our customers. These areas are benchmarked through performance and risk reporting coordinated anywhere from the unit and state level up to the Chief Environmental, Safety and Sustainability Officer, the Chief Operating Officer and quarterly, the Board of Directors.
The Compliance Assurance Program (CAP) is Essential’s Environmental Management System (EMS). Each Essential company has designated personnel (environmental directors, environmental managers, environmental specialists, etc.) who are responsible for supporting the CAP while focusing on environmental compliance. As part of our alignment with the elements of ISO 14001, Essential’s CAP is founded on the concept of “Plan-Do-Check Act.”
Plan |
Do |
Check |
Act |
Policy | Corporate Programs | Compliance Checking | Root Cause Analysis |
Benchmarking | State SOPs | Water Quality Tracking | Corrective Actions |
Target Setting | Communications | CAP Meetings | Programmatic Changes |
Regulatory Register | Training | Auditing | External Support |
Risk Analysis | Emergency Planning | Management Reviews | Peer Reviews |
In addition to routine communications and activities, special CAP meetings are held multiple times per year for each state and business and are attended by presidents, vice presidents, directors, managers and operations staff from corporate and state compliance, operations and engineering. Topics covered in these meetings include compliance metrics, water quality, environmental events, regulatory and company hot topics, and system/project review. Actions, events, activities, documents and records are tracked and managed in our Environmental Health and Safety Data Management System software.
Additionally, Essential is in the process of implementing a water quality data management system across its water and wastewater utilities. This will ultimately serve as the central repository for all water and wastewater quality data, providing company-wide access to trends and early identification of developing issues.
The purpose of our business continuity plan is to keep all our water and wastewater plants and operating facilities online and in compliance with applicable regulatory requirements. This plan also promotes appropriate maintenance of distribution systems, uninterrupted water supply and wastewater processing and the health and welfare of our employees, customers and their families.
Essential’s business continuity plan for water and wastewater operations covers the following key areas:
Similarly, Essential’s gas utility also has a detailed emergency response plan that outlines the procedures, guidelines, organizational support and communication to respond to natural gas emergencies on pipeline systems, customer service outages or other natural disasters that present potential hazards to the public, property or environment. The purpose of this emergency response plan is to keep all our gas facilities and systems online and in compliance with regulations and regulatory requirements. The plan is reviewed and updated annually with all operating personnel, and tabletop exercises and emergency simulations are conducted to provide the general knowledge and preparedness to respond to these types of events.
Our Eastern Seaboard Hurricane Plan is applicable to New Jersey, North Carolina, Pennsylvania and Virginia water and wastewater operations. This plan is updated annually, and its purpose is to aid in the mitigation, preparedness, response and recovery from hurricane and severe storm conditions that threaten or impact Essential’s community water system facilities. It also includes intracompany mutual aid. A similar plan is used in Texas.
Once a hurricane’s path has been identified with a probability that it will affect any of our water systems, it is the responsibility of the state presidents, or their designees, to initiate interstate company communication and preparation for the impending hurricane or severe storm. We use an EPA Hurricane Incident Action Checklist for water utilities as a template to assist the states. It includes individual checklists which should be completed for the start of hurricane season, before an impending hurricane and after a hurricane.
Local and national contractors and vendors are listed to facilitate appropriate level of coordination prior to any event. Regions are required to contact their local contractors and vendors first, with national contractors and vendors to follow.
Operations teams work with communications managers when there is a need to release any type of public notification to Essential customers to ensure they are made aware of any potential disruptions to service.
To help support our organization’s business continuity, we have kicked off a multi-year effort to achieve the following:
The first portion of this work, completed in 2021, developed an integrated Incident Management Plan and a Crisis Communication Plan for Essential Utilities, embedding our existing business continuity plans as sub-plans. The Incident Management Plan memorializes the processes, procedures and protocol necessary for responding to a business interruption occurrence or any other high- level uncertainties. The plan concentrates on safety, including the protection of life, assets and environment. Due to a change in personnel, the plan is currently under review. When updated, we will develop and exercise complimentary training for the new plan to ensure effective execution.
Once developed, these corporate-level plans will be updated annually for content and contacts.
The second portion of the work is a long-term initiative that will deliver new operation-specific Business Continuity Plans. These will be master plans for operational resiliency and recovery following a business interruption occurrence.
A complementary goal of this effort is to standardize the frequency and cadence of testing and simulation exercises across the organization. Today, these are performed throughout the organization but frequency and cadence varies across state operations.
Essential provides clean, safe, reliable water and wastewater services in the communities it operates. As a publicly regulated utility, Essential must follow all federal and state water compliance regulations, including those from the Environmental Protection Agency (EPA). We work hard to meet our goal of operating with exceptional compliance with the Safe Drinking Water Act. Across the 1,500+ water systems we own and operate, this compliance allows us to provide safe and reliable drinking water for all customers.
We are committed to providing reliable and efficient wastewater treatment and strive to operate our 200+ wastewater systems in compliance with the Clean Water Act. Most wastewater ultimately ends up back in local rivers or streams, so it is vital that Essential treats all wastewater before it is discharged.
At Essential, we have the technical expertise and experience to offer superior wastewater services that meet all environmental and public health standards. We are continuously modernizing wastewater treatment methods, ensuring our systems protect the surrounding environment and adhere to current standards. Our goal is to return water to our streams and rivers cleaner than when we took it – after a thorough treatment process that includes screening, primary clarification and biological treatment. Beyond returning water to the source, we operate several plants that feature a wastewater reuse program that provides safe and treated irrigation water to local businesses, such as golf courses. This prevents discharge to streams and efficiently reduces demand for freshwater supply. We continue to proactively identify opportunities for wastewater reuse.
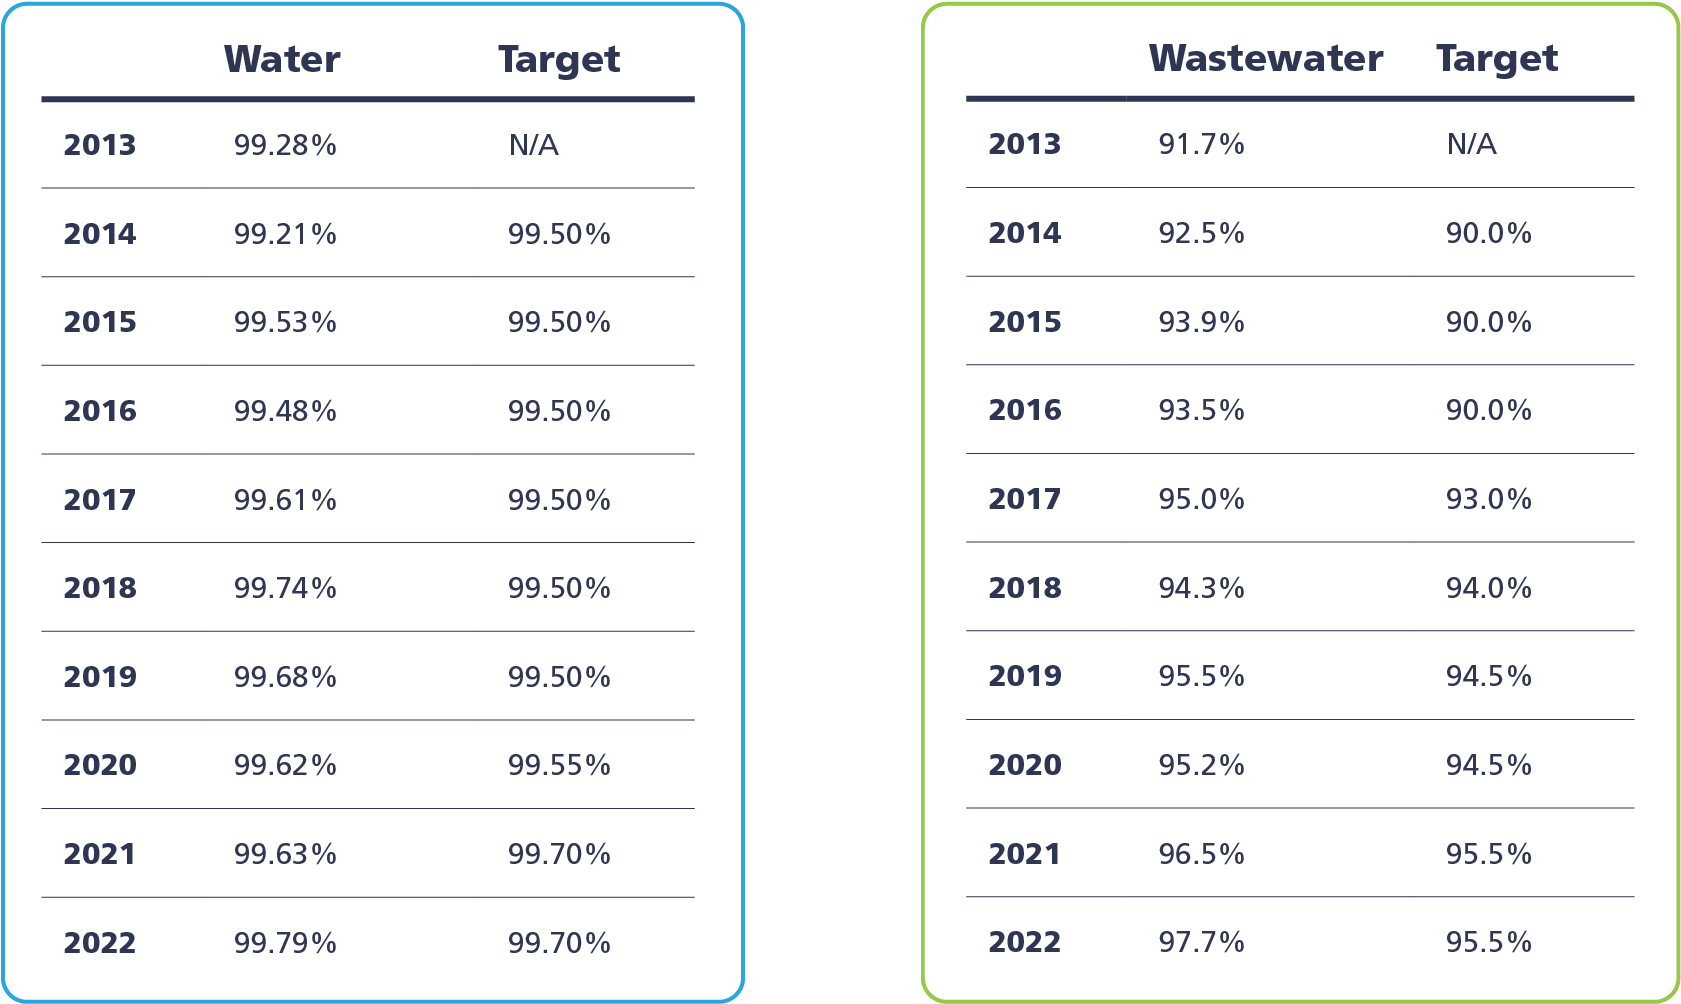
Measured by number of connections and presented as percent of water systems
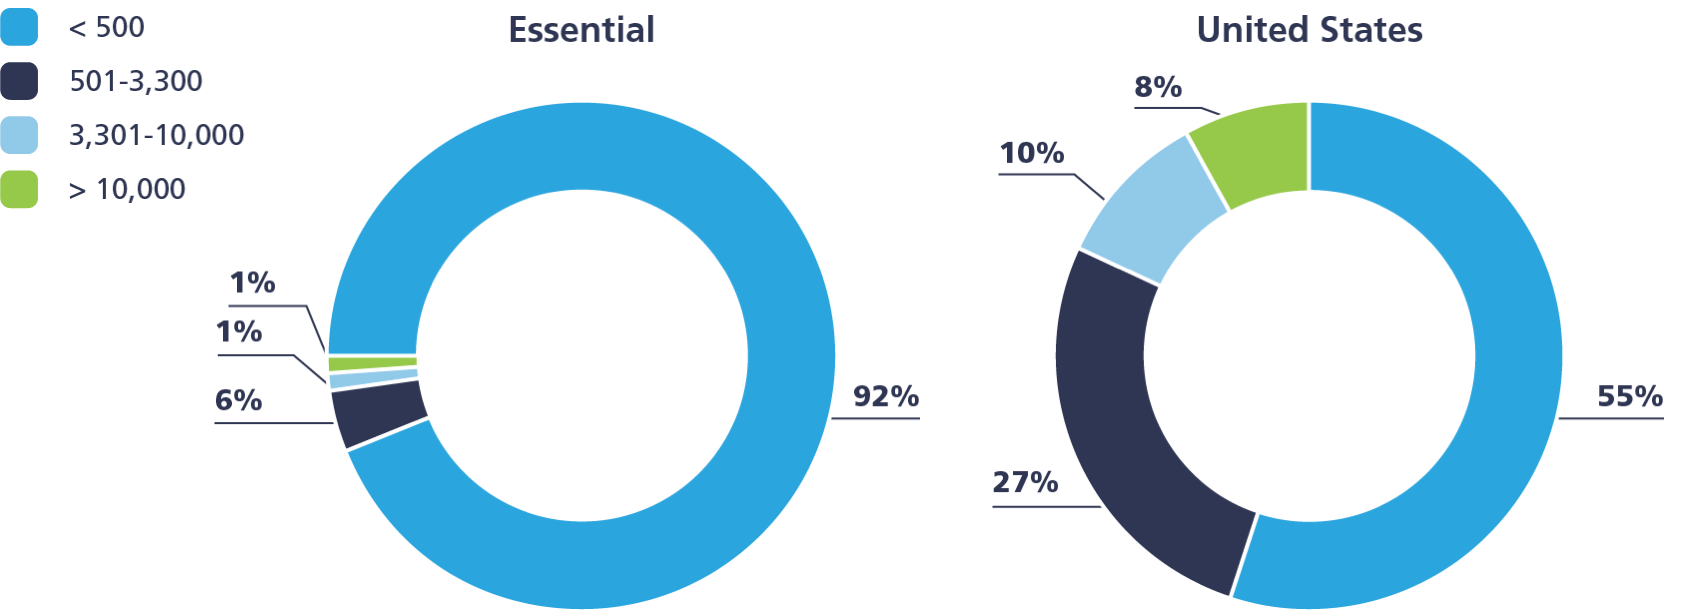
Measured by gallons of permitted capacity and displayed as percent of wastewater treatment plants
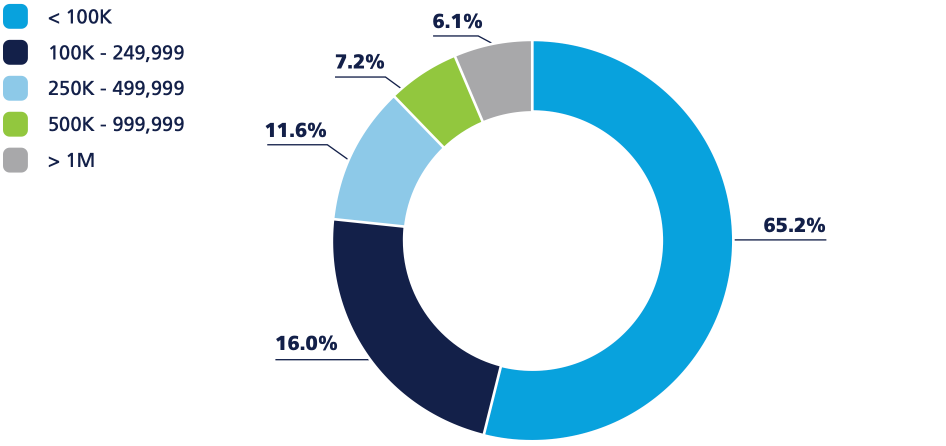
*17.3 billion gallons of permitted capacity
Essential’s rigorous compliance program ensures we meet all the local, state and federal regulations across our eight-state water and wastewater utility footprint, including requirements for permits for air, water, wastewater and related materials stored or disposed of as the result of our operational activities. Our
We rigorously track and measure our compliance performance, including the number of days Essential operates in compliance with given permits and regulations for both water and wastewater operations.
* To calculate the percentage of days in compliance, we utilize the AWWA benchmarking method, in which the number of days out of compliance, tallied for all our systems, is divided by the product of number of days in the year and the quantity of systems we operate. We compare this resulting figure against internal targets we had set.
According to the EPA, about 1 in 15 U.S. community water systems have health-based violations1.
Fewer than 1 in 50 Essential community water systems have had health-based violations in any given year. We are proud of our track record of outperforming the U.S. average at-large by, typically, at least four times and are consistently working toward improving that figure through investments in our water treatment and infrastructure.
2022 | 2021 | 2020 | |
---|---|---|---|
Systems with Tier 1 violations | 13 | 6 | 4 |
Systems with Tier 2 violations | 8 | 11 | 16 |
Systems with Tier 3 violations | 39 | 88 | 73 |
Total tier violations | 55 | 101 | 93 |
% of systems with tiered violations | 3.9% | 6.7% | 5.7% |
% of systems with tier 1 + tier 2 | 1.4% | 1.1% | 1.3% |
% of systems with tier 3 only | 2.6% | 5.8% | 4.8% |
Total # of systems | 1,512 | 1,518 | 1,522 |
Tiers as defined as per EPA regulations. https://www.epa.gov/dwreginfo/public-notification-rule
Tier 1 violations are defined as those violations of the National Primary Drinking Water Regulations (NPDWR) that require public notice and have significant potential to have serious adverse effects on human health as a result of short- term exposure.
These include very short term (1 day to 7 days) boil water notices and can be required due to loss of pressure from a water main break or due to the effects from a major storm. In Essential’s assessment, the year-on-year increases noted are not material in terms of the overall risk to our systems.
Tier 2 violations are defined as violations of the NPDWR that require public notice and have potential to have serious adverse effects on human health.
Tier 3 violations are defined as violations of the NPDWR not included in Tier 1 and Tier 2 that require public notice but are not considered to have a direct impact on human health (such as violations of monitoring and reporting).
Some prior year data, especially Tier 3 violations, may shift versus prior reporting. This is driven by timing differences related to the regulatory review process and this report preparation.
Measured as percentage of community water systems with health-based violations. U.S. averages compiled from the EPA’s ECHO Database
Essential | U.S. | Outperformance | |
---|---|---|---|
2022 | 1.4% | 6.7% | 4.8x |
2021 | 1.1% | 6.3% | 5.7x |
2020 | 1.3% | 6.6% | 5.1x |
Some prior year data may shift versus prior reporting. This is driven by timing differences related to the regulatory review process, time it takes for EPA to provide country wide data and this report preparation.
About 92% of our water systems are comprised of fewer than 500 connections. Even when Essential’s very small water systems are compared with U.S. averages for their size bracket, the trend still holds: We greatly outperform the U.S. average at-large for water quality.
Essential annually publishes water quality reports, or Consumer Confidence Reports (CCRs), on its website. CCRs summarize the quality of water Essential provides for each water system, including information about its water sources, what its drinking water contains and how it compares to standards established by the EPA. Please visit our website for more information and to access these reports. We also encourage our customers to contact our customer service center with any questions or concerns about their water quality and service.
More than 90 contaminants are regulated in drinking water. They require testing at varying frequencies and locations within a system, depending on several factors. These required monitoring results are published in our CCRs. Beyond this mandated testing, we conduct operational monitoring to optimize our processes and source water monitoring to understand if water quality is changing over time in our systems. This data enables proactive improvements to treatment and investigation of better water sources we can develop and use.
In March 2021, we opened a brand new, state-of-the-art environmental laboratory at our Bryn Mawr headquarters. The exciting new lab is just one example of our commitment to operational excellence and our mission to protect the public health and ensure clean, safe, reliable water.
The new two-story building more than doubles the size of the previous laboratory that served the company for more than 70 years. This space allows us to adapt to the dynamic regulatory environment that will require additional sampling and equipment necessary for water and wastewater operations. It also accommodates our increasing footprint as we acquire additional customers and systems.
The lab employs 20 professional staff members, including microbiologists and chemists who perform approximately 300,000 tests on 30,000 water samples each year. These scientists use 50 various analytical methods for roughly 240 water quality parameters. The laboratory is certified by the Pennsylvania Department of Environmental Protection and four other state environmental or health regulatory agencies. And as we’ve transitioned from measuring in parts per million to parts per trillion, a million-fold increase in detection levels, we feel confident that we will be able to deliver water that is safe and that the wastewater we treat and return to our rivers, lakes and streams is cleaner than it is when we remove it to treat it for drinking water.
Essential’s primary duty is to meet the requirements of all local, state and federal regulations for its wastewater treatment plants. This means our wastewater systems must achieve greater than 90% removal of regulated elements during the treatment process.
In 2022, more than 99.98% of the wastewater volume we treated achieved this high level of compliance through our use of secondary treatment processes to remove organics and solid materials. However, in many sensitive areas – such as the Chesapeake Bay area – we used tertiary treatment processes to remove nutrients such as nitrogen and phosphorus as required by regulations.
Number of events of non-compliance associated with water effluent quality permits, standards, and regulations
2022 | 2021 | 2020 | |
---|---|---|---|
Events | 148 | 253 | 334 |
Days in compliance | 97.7% | 96.5% | 95.2% |
We attribute our trend of improvement to a combination of operational initiatives and capital projects, particularly in Texas.
Managing emerging contaminants in drinking water is a continuous process as science improves our ability to detect and understand the impacts and evolving nature of contaminants in water. We consider the latest science and research to identify potential contaminants of concern for further review, evaluation or action. We consider the prevalence and levels of these chemicals and their potential to cause human health or environmental harm. We also are involved in industry research, committees and organizations that track and study the latest in emerging contaminants to help us prepare for future needs. For example, Essential is participating in research studies with the Water Research Foundation on Legionella in distribution systems, corrosion control inhibitors and lead service line material identification.
Based on this information, we may choose to look at specific geographic locations or types of systems to further understand how these compounds occur and behave in the environment. If the levels warrant action, then we first prefer remediating the source of the chemical to avoid removal in the water or wastewater process. If the source is too diverse or not easily identifiable, we then evaluate treatment technologies for installation to protect our customers.
With this knowledge, we work with environmental regulators and with public utility commissions to gain the necessary acceptance and permissions we need to implement treatment solutions. During this process, we develop systems to communicate our findings with various agencies, organizations and customers. Finally, we review all the impacts from our activity footprint as we consider the long-term sustainability impacts on activities like material disposal.
Essential continuously reviews chemicals such as pesticides, pharmaceuticals and personal care products. We are currently conducting and monitoring scientific activities for per and poly-fluoro alkyl substances (PFAS – PFOA, PFOS, etc.), cyanotoxins, lead and manganese.
In February 2020, we announced that we will, over several years, install treatment technology at water treatment facilities where source water exceeds 13 parts per trillion (ppt) for three PFAS substances, individually: PFOA, PFOS, and PFNA.
PFAS is a concern in communities across the country where groundwater is believed to have been contaminated by nearby military bases or other causes. Since setting a company-wide standard of 13 ppt in 2020, EPA has proposed new drinking water regulations for PFAS with limits of 4 ppt for PFOA and PFOS respectively. The EPA is also proposing to regulate the other PFAS constituents of PFNA, PFBS, PFHxS, and GenX. Essential will comply with the EPA regulations once finalized in the coming years.
What is it? Blue-green algae source, called by specific sub-names of microcystin, saxitoxin and cylindrospermospin.
What are the risks? Found in surface waters due to harmful algae blooms (sometimes referred to as HABs). If levels are not removed during treatment, very low levels of cyanotoxins can trigger health advisory levels leading to “do not drink” or “do not use” orders for customers.
How does Essential manage this contaminant? We implement source water protection practices, monitoring, removal technologies, and the latest software that uses learning based on data to develop algorithms to predict cyanotoxin levels and optimize treatment of cyanotoxins to safe levels.
What is it? Source is lead solder, lead pipes and lead in older fixtures.
What are the risks? If corrosion control is not properly maintained or the material is physically disturbed, dissolved and particulate lead can be released. Lead is toxic and can potentially impact children’s development.
How does Essential manage this contaminant? Our lead efforts focus on water quality optimization to prevent lead release, customer education to raise awareness of how to minimize lead exposure, monitoring to identify sources and confirm water quality is optimized, and removal of lead service lines. We are currently inventorying all our water service line materials and replacing any lead service lines that we identify. We inform customers about how to minimize lead exposure both before and after the service line replacement by flushing and using pitcher filters that we supply for six months.
What is it? Per or poly-fluoro alkyl substances, called PFAS, is a family of almost 5,000 constituents that have been used in common household items, military applications and manufacturing since the 1940s, including the more well-known sub-species of PFOS and PFOA. PFOS was primarily used in firefighting foams while PFOA was used in most non-stick materials including common household items, clothing, office supplies and even food containers.
What are the risks? Some PFAS sub-species have been linked to cancer and non- cancer health impacts at very low levels of exposure. The ubiquitous presence in the environment and requirements to remove to very low levels require expensive treatment systems. States regulations differ on the safe levels and standards, while a federal standard has not yet been finalized.
How does Essential manage this contaminant? Essential has surveyed all its systems for PFAS and has the capability to conduct the analysis at its lab. We have adopted a policy to treat any system with a level of PFOA, PFOS or PFNA of 13 ppt or greater individually. Essential has installed treatment systems on several systems with elevated PFAS levels and continues to participate in studies and research to proactively manage PFAS. Essential also is reviewing the EPA’s proposed drinking water regulations for PFAS constituents and will comply with them once finalized.
Essential’s water and wastewater footprint provides necessary drinking and wastewater treatment services to thousands of customers across our multi-state footprint.
Our customers can play a significant role in the promotion of water efficiency. Essential tracks the water consumption trends of our customers to better manage water resources and to help safeguard sustainable sources of water for future generations. One of the most impactful findings has been a steady decline in water consumption by our customers over the past several decades – largely driven by improvements in the water efficiency of home appliances.
Essential proactively shares information through mailers and social media with our customers to enhance their experience and provide additional information on topics that help them save money and conserve water.
We also provide WaterSmart alerts, an automated customer notification designed for quick, reliable communications on a customer’s water safety and service in case of disruption.The EPA’s Fix a Leak Week, which serves as an annual reminder for households to check their fixtures for leaks, also provides an opportunity to engage customers via social media and on our website.
We join our customers in pursuing opportunities for efficiency and strive to model environmentally friendly practices. Across our corporate office and facilities footprint, Essential seeks to use efficient appliances, fixtures and building systems where feasible. In various locations, we have implemented low-flow water faucets, water-saving toilets, LED lighting systems and have evaluated solar and energy savings opportunities across the company where possible.
We routinely conduct efforts to responsibly manage Essential’s water sources against situations that could stress those sources, including drought planning and future demands from growth.
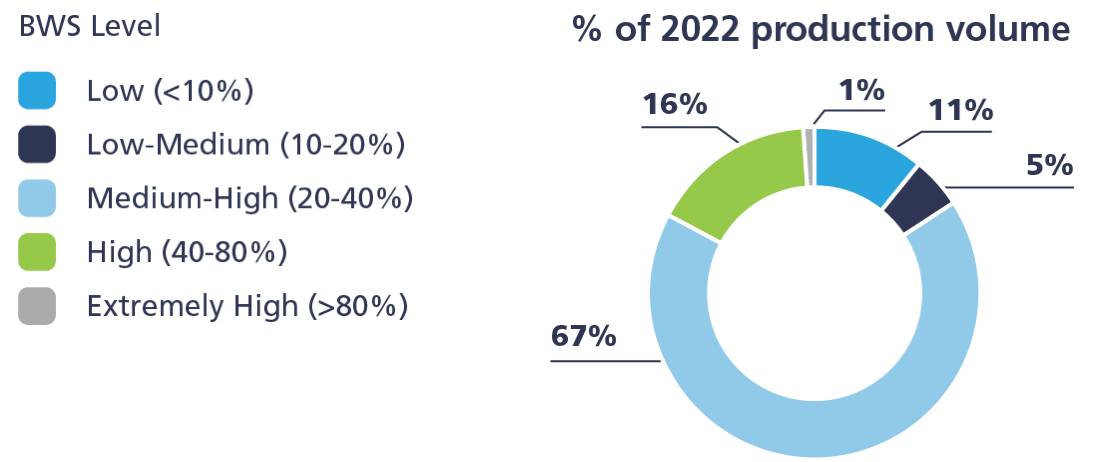
To help inform these efforts, we had an analysis conducted using the WRI Aqueduct tool to look at our systems and production by WRI’s Aqueduct Baseline Water Stress (BWS).1
This analysis is considered a broad, high-level regional analysis and may not represent the true level of stress on a source locally, nor does it consider management of sources by groundwater conservation districts, river basin commissions or other local, state and federal agencies. Regardless, we conducted the exercise to understand the potential regional water stress in Essential’s service areas. The analysis compared the location of Essential systems to the BWS coverage provided by WRI Aqueduct in a Geographical Information System (GIS). The system’s representative annual production in 2022 was then sorted to the BWS categories of low, low-medium, medium-high, high or extremely high as indicated by WRI. As shown in the table below, roughly 17% of Essential’s water produced in 2022 was sourced from regions with baseline water stress identified as high or extremely high. However, it is important to note that several large systems make up significant portions of our water production and thus can significantly influence these results. For example, the Essential main system serving a large region of Southeastern Pennsylvania is in the Delaware River basin. The entire Delaware River basin baseline water stress is labeled as medium-high in the WRI Aqueduct tool, but this does not factor in the significant regulation and careful management of the entire basin’s water resources by the Delaware River Basin Commission and surrounding states since the 1960s.
Essential will continue to evaluate and examine potential opportunities and technologies to recycle water and reuse wastewater. We monitor and address sites that are more prone to water scarcity individually. In 2022, we recycled approximately 628.7 million gallons of treated wastewater to the groundwater recharge via spray irrigation, drip irrigation and subsurface infiltration approximately. This is 5% of the total wastewater treated in 2022, with the remainder safely discharged to streams, rivers or lakes.
2022 | 2021 | 2020 | |
---|---|---|---|
Total recycled water (million gallons) | 628.7 | 629.9 | 493.9 |
% Total Water Production | 0.7% | 0.7% | 0.6% |
% Total Wastewater Treated | 5.6% | 5.7% | 4.3% |
* As defined by WRI Aqueduct, Baseline Water Stress measures the ratio of total water withdrawals to available renewable surface and ground-water supplies. Water withdrawals include domestic, industrial, irrigation and livestock consumptive and non-consumptive uses. Available renewable water supplies include the impact of upstream consumptive water users and large dams on downstream water availability. Higher values indicate more competition among users (*Hofste, R., S. Kuzma, S. Walker, E.H. Sutanudjaja, et. al. 2019. “Aqueduct 3.0: Updated Decision- Relevant Global Water Risk Indicators.” Technical Note. Washington, DC: World Resources Institute. Available online at: https://www.wri.org/publication/aqueduct-30.)
The U.S. has a very fragmented network of aging water systems, with more than 150,000 water systems serving nearly 320 million people. Most Americans receive their drinking water from community water systems, which are primarily run by local municipalities. Unfortunately, maintenance on these systems can be expensive, and costs are rising fast – from stricter regulations to the rising costs of labor and materials, to the additional expertise needed to handle modern challenges – it’s getting harder for municipalities to effectively run their water and wastewater systems.
As a result, many municipalities have and are deferring maintenance – which is a risky decision that can have serious consequences on the safety and reliability of a water system over time. We are proud to work with municipalities and play a leading role in providing solutions for communities that are struggling to keep up with these challenges.
Essential recognizes the construction activity in the communities we serve can cause disruption. We work alongside community leaders to minimize impact. Coordinating with communities on paving schedules, aligning schedules with other public works projects, and ensuring our projects address any community expectations. We work hard to leave a street in better condition than when we found it and to minimize disruptions during the construction process by keeping our customers informed through communications and often personal knocks on their door to discuss the impact and identify ways to mitigate it.
This commitment is illustrated, for example, through our partnership with Bourbonnais, Illinois. Check out this video for a profile on our service in this community.
The capital planning programs utilize several strategies to evaluate both the short-term and long-term infrastructure needs across the footprint. Our processes evaluate the water and wastewater capacity, condition and operational performance of our systems. The capital planning program includes master planning to determine supply against projected customer growth, treatment performance evaluations for current and future contaminants, asset condition assessments for efficiency, compliance management, and safety requirements. Essential conducts a rotational facility audits of our surface water plants to ensure timely assessment of our infrastructure investment requirements. Our asset management program relies on concepts of likelihood and consequence of failure to drive decision-making on which infrastructure to prioritize for repair or replacement.
When an unplanned event occurs in one of our systems, Essential utilizes a customer disruption map to keep our customers informed of planned and unplanned occurrences. This data is used to help inform our asset management and capital planning efforts to reduce these occurrences in the future through investment or operational changes.
2022 | 2021 | 2020 | |
---|---|---|---|
Number of unplanned service disruptions | 2,634 | 3,135 | 1,805 |
Number of unplanned service disruptions (normalized per 100 miles) | 18.4 | 19.0 | 13.2 |
Note: These year-on-year changes are likely primarily driven by better data collection and data quality that we have been working towards in recent years, across each of our states. The company is focusing efforts on more comprehensive disruption tracking and training which may increase our tracking numbers in the near term while providing us the opportunity in the long term to focus attention and remediation measures to reduce this impact to our customers.
There are several ways that untreated or partially treated wastewater can make its way into the environment, creating negative health and safety impacts for humans and the greater ecosystem.
This can even occur before wastewater arrives at a treatment plant, especially during periods of severe storms and flooding. This can cause inflow and infiltration, overwhelming the ability of main infrastructure to accommodate volumes of flow. Essential takes numerous steps to minimize all discharge occurrences and volumes through operational excellence and proactive capital investment. It is critical to note that Essential treats more than 99.9% of wastewater volume to achieve regulatory compliance. However, in 2022, we experienced 149 wastewater-related discharge events that led to a collective 9.2 million gallons of untreated or partially treated wastewater that regrettably ended up in the environment. More than two-thirds of these occurrences were related to precipitation events.
Much of this volume of wastewater-related discharge events (77.3%) is attributed to unanticipated plant bypass events. This occurs when wastewater arrives at a treatment plant but is unable to be fully treated. This can be due to unmanageably high flows during storm events or due to accidents or failures in infrastructure. We continually work to improve the capacity of our wastewater treatment facilities to handle peak flows and mitigate risk of unanticipated plant bypass.
Nearly all the remaining wastewater-related discharge events by volume (22.3%) are attributed to sanitary sewer overflow (SSO) events. SSOs occur when untreated sewage is discharged from a sanitary sewer into the environment prior to reaching one of our wastewater treatment facilities. An SSO can be caused by a variety of things, including pipe clogging and equipment failures at pump stations. Most frequently, however, SSOs are caused during wet weather periods when the sewer system capacity is exceeded by infiltration and groundwater seeps through cracks in the pipe system. In 2022, we observed 86 SSO events that led to about 2 million gallons of discharge into the environment.
We work to reduce SSOs and sewage related events by regularly inspecting and cleaning sewer pipes, replacing aging sewer pipes to reduce inflow and infiltration, maintaining and upgrading our pump stations, educating customers about what not to put down the drain and monitoring for fats, oils and grease disposed of by businesses.
2022 | 2021 | 2020 | |
---|---|---|---|
# Wastewater-related discharge events | 149 | 183 | 198 |
# SSO Events | 86 | 124 | 118 |
Total volume of wastewater treated (gallons) | 11.2 billion | 11.1 billion | 11.5 billion |
Wastewater-related event volume (gallons) | 9.2 million | 5.7 million | 6.8 million |
SSO Volume (gallons) | 2.1 million1 | 0.4 million | 0.2 million |
% Volume of wastewater-related discharge events related to precipitation | 68.2% | 76.9% | 97.7% |
% Unanticipated plant bypass by volume | 77.3% | 92.3% | 93.9% |
% SSO by volume | 22.2% | 6.8% | 3.3% |
% Plant spill | 0.5% | 0.9% | 2.7% |
% Wastewater volume that is fully treated | 99.92% | 99.95% | 99.94% |
Miles of system | 2,678 | 2,552 | 2,506 |
# SSO/100 miles of system | 3.2 | 4.9 | 4.7 |
* In 2022, we experienced a significant increase in SSO volume. This was driven by one location where we observed 1.5-million-gallons spread out across three successive events driven by unusual weather patterns. We are undertaking capital ESSENTIAL UTILITIES upgrades to address this issue and mitigate further risk of SSOs.
Extreme flooding can also pose a risk to the integrity of operations at wastewater treatment plants, presenting a situation where a sanitary sewer overflow, as Essential more broadly defines this, can develop as untreated wastewater escapes into the surrounding environment. In the past year, we have performed a detailed analysis of how much of our wastewater capacity falls within 100-year flood zones (1% annual chance of flooding) by comparing the location of each plant to the FEMA National Flood Hazard Layer. Essential operates 203 wastewater treatment plants (WWTPs) across its footprint, and we determined 78 Essential WWTPs (38%) fall within a 100-year flood zone and 111 fall within a 500-year flood zone (55%). This represents 49% and 47% of Essential’s permitted wastewater capacity, respectively. Note that this analysis only considered whether the WWTP was located within the flood zones and did not account for any flood prevention measures that might already be in place at those WWTPs. Essential carefully plans for flooding events and has implemented considerable mitigation efforts and processes to substantially reduce associated risks. Essential has taken this analysis further looking at the topography of each site to determine risk of flooding and is making investments to reduce it.
We conducted a similar analysis for our water production infrastructure and note that 95% of 2022 water production volume fell within a 500- year flood zone, 4% fell within a 100-year flood zone, and 1% of water production occurred outside of these flood zones. With recent storm flooding events at one of our major plants occurring, Essential is acutely aware of the impact of climate change flooding. Essential is utilizing the American Water Infrastructure Act (AWIA) requirements to conduct risk and resiliency studies at each of our large facilities and then cascading down through our system based on size to look risks posed by flooding and other events. Results from these analyses are used to inform our capital and operational planning efforts.
One of Essential’s primary responsibilities is to manage water resources carefully. We do this in part by identifying ways to reduce water loss – ways we do that include:
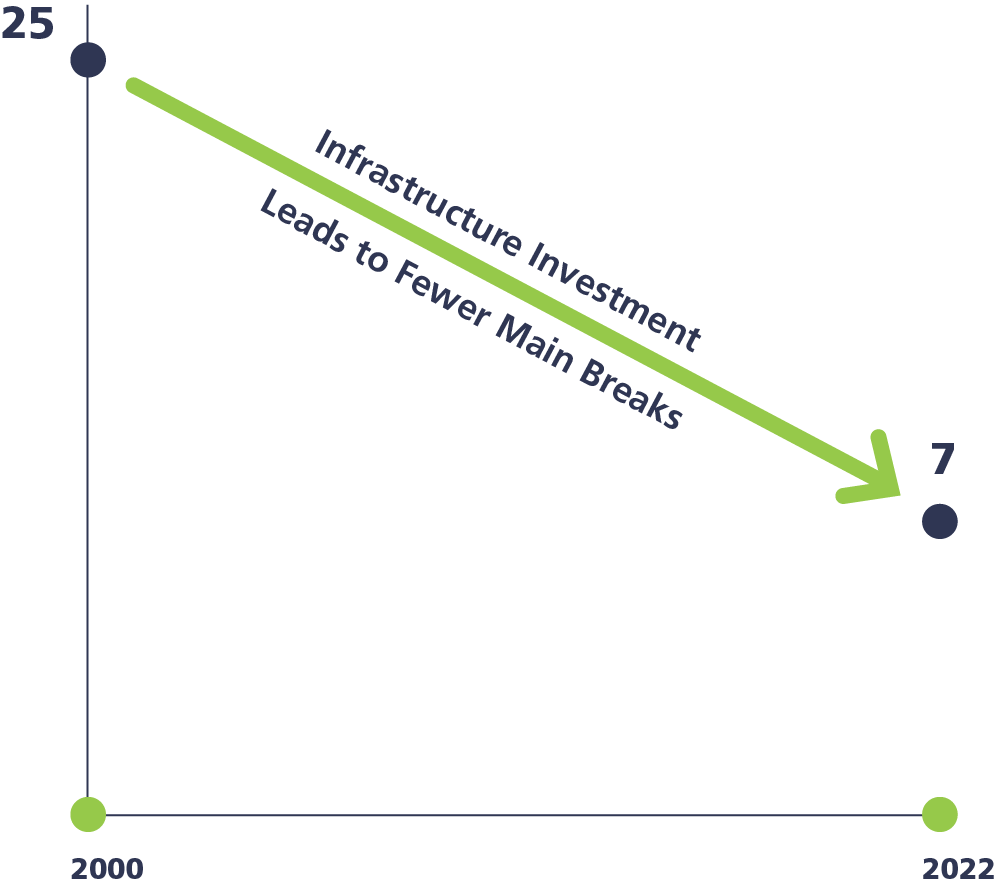
Our significant investment in water infrastructure has proven to be a very successful way to reduce water main breaks and water loss. For example, in 2000, Essential experienced nearly 25 main breaks per 100 miles on the pipe we own in southeastern Pennsylvania. In 2022, we experienced fewer than 7 main breaks per 100 miles on that system. This not only reduced water loss, but reduced the volume and cost of emergency repairs, reduced service interruptions and improved water service for customers.
Keeping to this commitment, Essential replaced more than 125 miles of water main in 2022 and plans on replacing 176 miles of water main in 2023 to continue to address water loss and improve water quality and reliability for customers.
Essential has implemented innovative tools to advise our teams of potential sources of contamination from various sources under a Geographic Information System (GIS), mapping tool. GIS mapping software combined with satellite imagery have proven to be effective tools for locating leaks and reducing water loss.
Essential has launched a strategic transient pressure monitoring program to look at main break trends and deploys cellular-based internet-of-things (IoT) devices to monitor pressures in an area. These devices measure pressure thousands of times per second and when the data from the different sites is correlated, we can target the source of the issue. Recent examples have identified booster pumps in systems with faulty starting devices causing excessive pressure spikes on the system which would have gone undetected without this technology deployment. Those repairs have shown a direct correlation to reduced water loss, main breaks, and improvements to water quality.
2022 | 2021 | 2020 | |
---|---|---|---|
Main breaks per 100 miles | 37.6 | 30.3 | 22.9 |
Note: We believe much of the year-on-year variability is the result of better data collection and data quality that we have been working towards in recent years across each of our states. We believe that, in actuality, there has been a decrease in main breaks across the company and this is true when we look at certain individual state operations, such as our largest state of Pennsylvania. We hope these data improvements will allow for more direct year-on-year comparisons in the future. We believe it is likely that these figures are artificially inflated due to a different definition of “main break” used in some of our operations. The company implemented new standardized processes and applications to consistently track information in 2022.
2022 | 2021 | 2020 | |
---|---|---|---|
Volume (billions of gallons) | 17.8 | 17.2 | 17.8 |
% of total production | 20.5% | 20.3% | 20.9% |
Note: Data is displayed here in both the absolute value of volume as well as a percentage of total production. This normalizes the data and accounts for changes in total water production, or send out, across years. We believe that, due to our acquisition of new water systems over time, and the practical margin of error with measurement equipment in the field, our levels of non-revenue real water loss have remained materially consistent over the past three years.
Non-revenue water losses represented here include leakage (real losses), apparent losses, (such as theft and meter inaccuracies) and other instances, such as water main flushing and water for emergency fire services. These values are determined based on the difference between water production and water ultimately delivered to customers and billed.
Essential’s gas utility operation serves customers in southwestern Pennsylvania, northern West Virginia and eastern Kentucky. We operate more than 15,400 miles of distribution and transmission pipelines in these areas. Essential also owns and operates more than 2,000 miles of gathering pipelines, 29 compressor stations and seven underground storage fields.
Of our 15,400 miles of distribution and transmission pipelines, approximately 18% is made of older vintage (prior to 1970) bare steel or cast/wrought iron and has been identified as aging infrastructure in the company’s Long-Term Infrastructure Replacement Program (LTIIP). This modernization program targets replacement of all aging infrastructure by 2034. Our Distribution Integrity Management Program (DIMP) and Transmission Integrity Management Program (TRIMP) formally operate and maintain these facilities thorough asset management processes and procedures. We integrate newer pipeline materials, most notably plastic, into our system that are more environmentally friendly over their lifetime than the materials commonly used previously. These materials are more durable, safer and more resistant to corrosion and leaks, reducing methane emissions.
Percentage of distribution pipeline that is (1) cast and/or wrought iron and (2) unprotected steel
2022 | 2021 | 2020 | |
---|---|---|---|
Cast or Wrought Iron | 0.45% | 0.48% | 0.51% |
Bare Steel | 17.8% | 19.4% | 21.3% |
Our robust inspection and maintenance activities, which are aligned with state regulations that outline the use of various leak detection technologies and methods, mitigate significant pipeline incidents. The Pennsylvania Public Utility Commission (PA PUC) annually reviews and audits our plans for their compliance with all requirements and regulations.
Essential has an aggressive Damage Prevention program to minimize third party excavation damages. Over the three-year period from 2020 to 2022, we experienced a 6% reduction of damages per 1,000 tickets received. Additionally, we have been installing excess flow valves (EFVs) for new services that operate above 10psi to automatically stop the flow of natural gas if the service line is damaged.
At Essential, we are committed to minimizing the amount of waste produced at our treatment facilities and corporate offices and ensuring that any waste created is handled responsibly.
Because the waste produced at our treatment facilities is organic matter, in many cases, it can be beneficially reused in farming and land application. The nutrients in the organic solid waste are valuable to crops and can help replenish soil and therefore can be applied to the land in the place of fertilizer or manure. When it cannot be reused, the waste is sent to a landfill or to be further processed at another facility.
Most of our waste is organic residual from our treatment processes. As stated, a significant majority is beneficially reused.
Because there is a very limited generation of hazardous waste as part of our operations, we do not have an active hazardous waste management program at an enterprise level. We are, however, building better waste management manifests for each of our states and creating a contractor database to promote tracking on the vendor level. Any accidental chemical spills or fuel waste from vehicles and generators are remediated following all local, state and federal environmental rules by certified contractors.
The air emission data presented below represents non-GHG gas emission data that has been reported to state agencies for the Essential footprint. These include facilities with compressor stations or multiple large emergency generators. The data below does not include air emissions generated from vehicles and permit exempt emergency generators.
Description | Beneficial Reuse / Recycled | Landfill | Incineration | Total |
---|---|---|---|---|
Treatment of water | 47,894 (Land application) |
5,327 (100% in company owned landfills) |
N/A | 53,2211 |
Treatment of wastewater | 2,194 (Land application) |
4,282 | 721 | 7,196 |
Office waste / miscellaneous non-hazardous waste | 347 (Recycled) |
2,368 | N/A | 2,714 |
Natural gas liquids | 491 (Fuel blending) |
N/A | N/A | 491 |
Hazardous waste | 2.0 | N/A | 10 | 12 |
Total waste | 50,928 | 11,977 | 731 | 63,624 |
Emission Type | 2022 (Dry Metric Tons) |
2021 (Dry Metric Tons) |
2020 (Dry Metric Tons) |
---|---|---|---|
Nitrogen Oxides (NOx)3 | 211.0 | 237.9 | 264.2 |
Particulate Matter (PM10) | < 10 | < 10 | < 10 |
Sulfur Oxides (SOx) | < 1 | < 1 | < 1 |
Volatile Organic Compounds (VOCs) | 45.8 | 187.0 | 201.3 |
Hazardous Air Pollutants (HAPs) | 23.2 | 41.9 | 45.2 |
1 We record waste volumes upon removal from our site, consistent with regulatory reporting requirements. We may temporarily store waste on site in significant volumes and ship in a different year than when generated. Therefore, year over year, this data will vary.
2 Emission data from sources within the scope of our required regulatory air emissions reporting. VOC and HAP emissions decreased from previous reporting in part due to alterations to regulatory methodology
3 Nitrous oxide (N2O) is a greenhouse gas, but we have included it in this section summed with other nitrogen oxides for completeness and because it constitutes a small amount of our total NOx emissions
* While Essential consumes the energy generated from onsite solar installations, we sell the associated renewable energy credits (RECs) in the marketplace.
Type | 2022 | 2021 | 2020 |
---|---|---|---|
Energy consumed (MWh total energy consumed) | 763,277 | 762,373 | 747,018 |
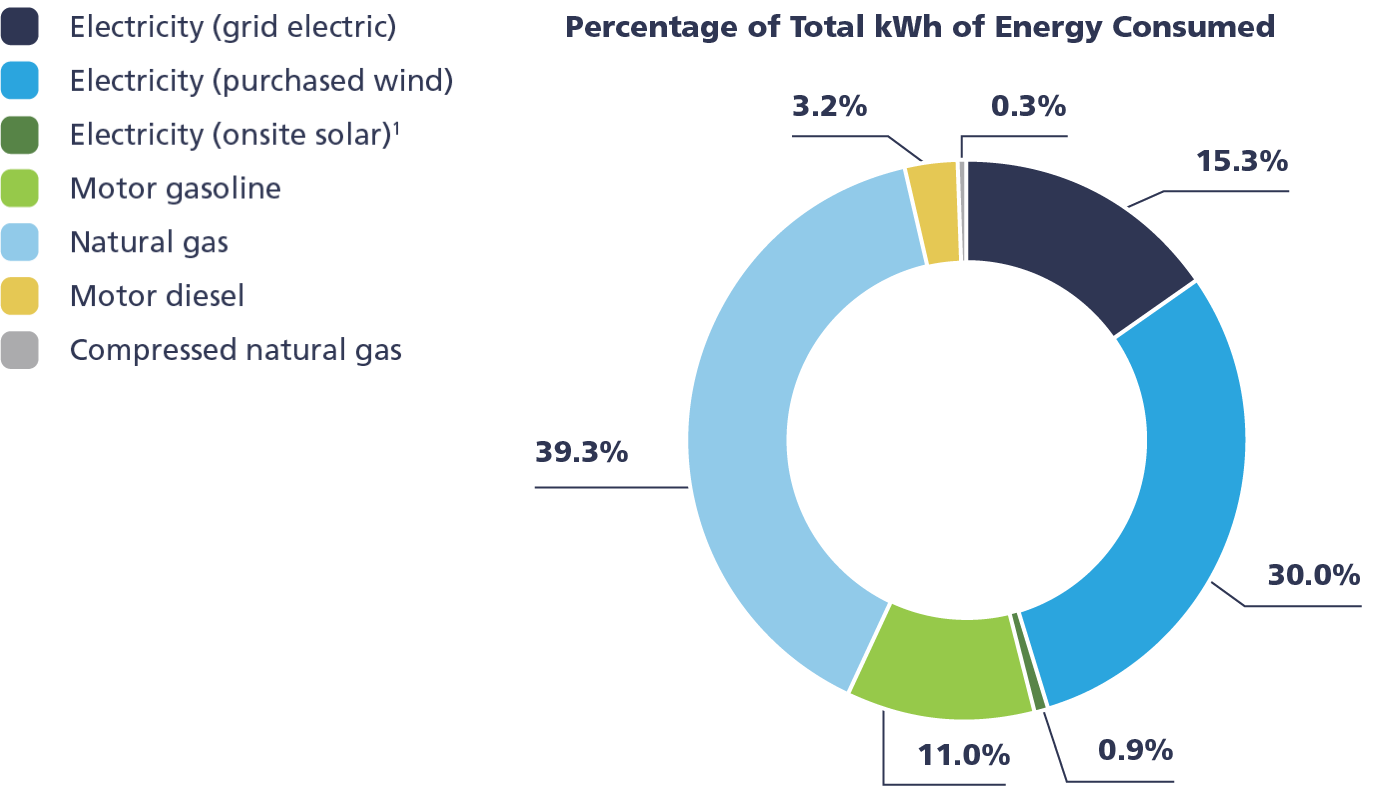
Energy derived from renewables | 30% | 4% | 4% |
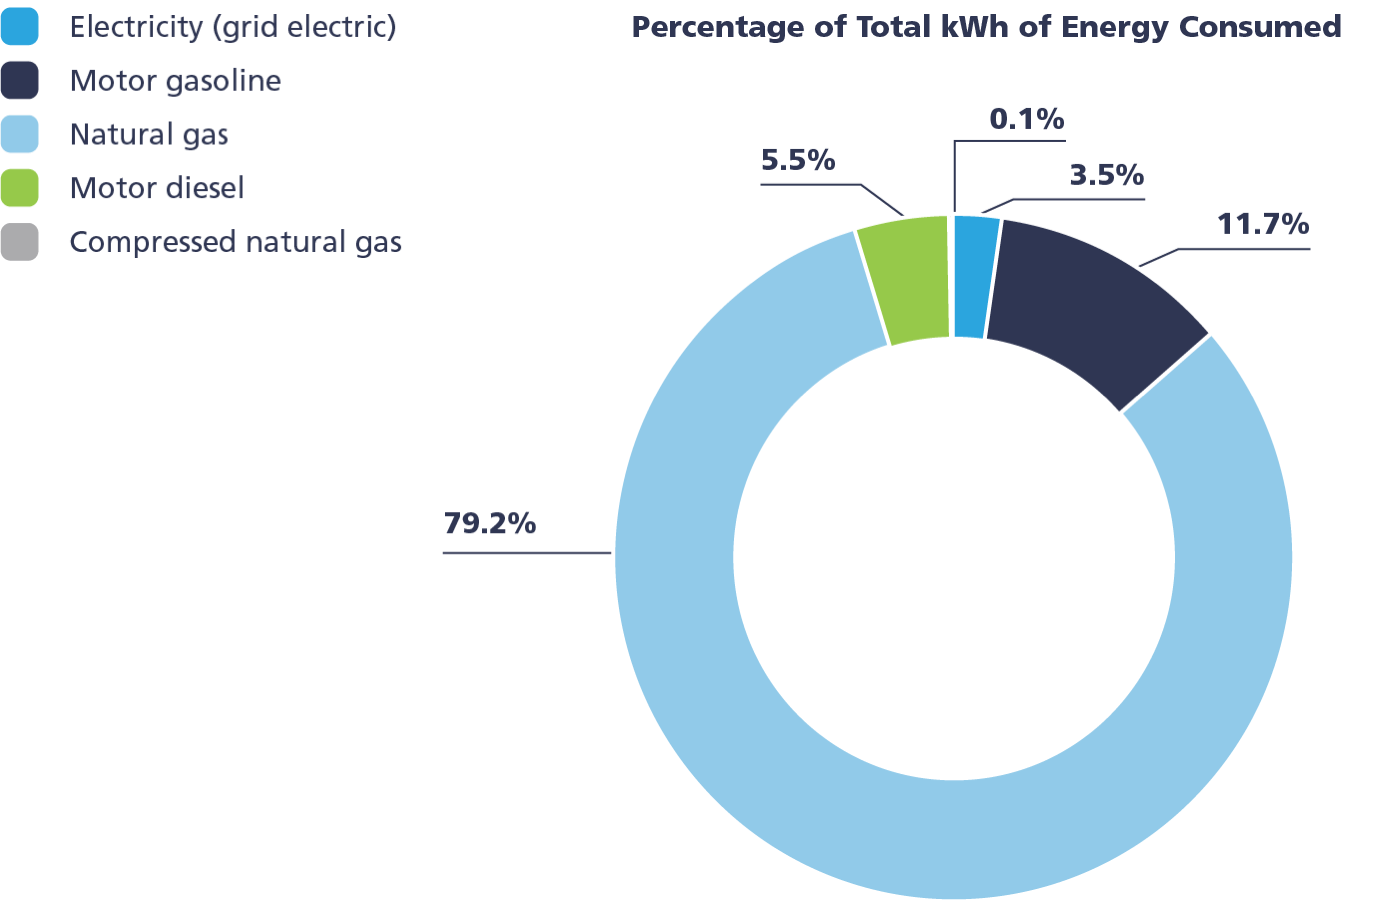
The physics of moving vast amounts of water and wastewater through networks of pipes to and from Essential’s plants requires extensive amounts of energy; about 80% of the total energy consumption required across our operations is related to water operations and about 20% is related to wastewater services. We rely on several different sources of energy for various business activities.
Electricity is our most consumed form of energy and nearly all of the electricity we use is needed to operate pumps and treatment equipment at our plants, with the small remainder used in our offices. Vehicle fuel is the second largest source of energy for Essential, as we operate a fleet of vehicles for regular physical monitoring of our infrastructure. Natural gas is used to heat our facilities and is our third largest energy source.
The physics of moving vast amounts of water and wastewater through networks of pipes to and from Essential’s plants requires extensive amounts of energy. Our total energy consumption in this area of our operations has been relatively consistent over the last three years with increases attributed to acquisitions and the organic growth of our business.
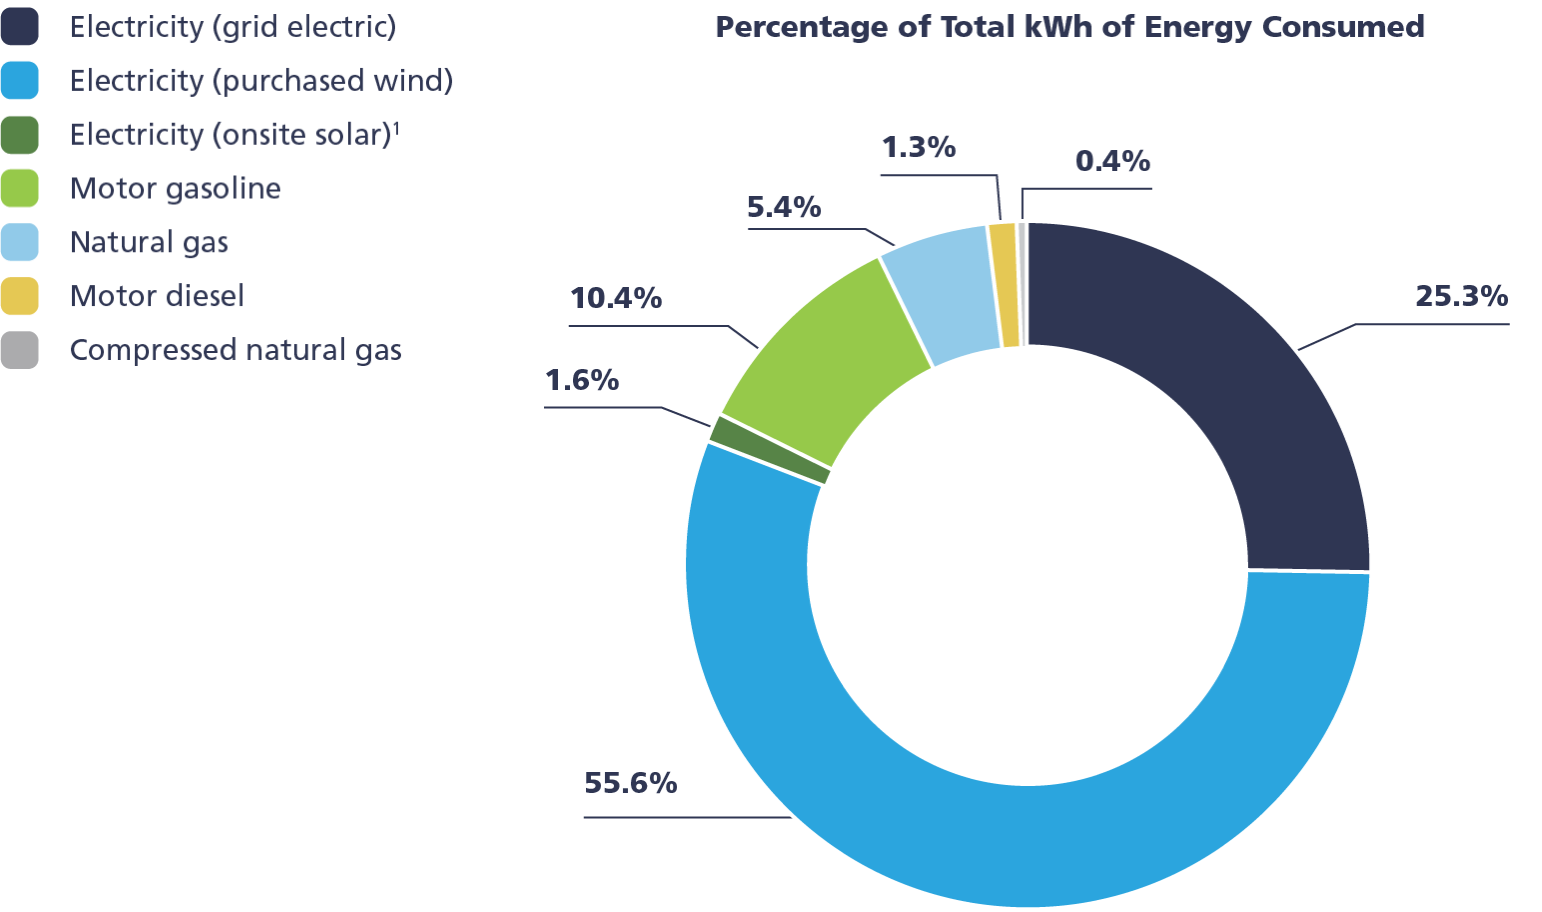
Essential has also contracted to source 25% of its electricity in Aqua Texas through an offsite solar power purchase agreement (PPA), which started in June 2020. These states feature deregulated energy markets which allow for this arrangement.
2022 | 2021 | 2020 | |
---|---|---|---|
Energy consumed (MWh total energy consumed) | 412,067 | 394,371 | 390,831 |
Energy derived from renewables (percentage renewable) | 56% | 7% | 8% |
2022 | 2021 | 2020 | |
---|---|---|---|
Total energy consumed (MWh) | 351,210 | 368,002 | 356,187 |
Energy derived from renewables | 0% | 0% | 0% |
Tracking energy intensity, or measuring energy efficiency from an economical perspective, allows Essential to benchmark operations across our regions and states and compare them to each other and against national metrics. Intensity tracking takes on additional importance with our very diverse network of water systems across eight states. While our median water system is 64 connections and economies of scale favors larger systems for single efficiency opportunities, our large number of nearly identical smaller systems provides an opportunity to replicate energy efficient methods across many similar systems.
For water, energy intensity is expressed as kilowatt hours (kWh) of energy usage per 1,000 gallons of water (kgal) produced. These energy intensity values are highly dependent on physical factors, which vary not only state to state, but by region and location. Changes in regulations may also lead to more energy-intensive practices over time, making long-term trend analysis difficult. The depth and lift required to gather water and the pressure required to pump water across distance and elevation are the most significant factors in energy intensity. Because of our large number of smaller systems, heating pump stations during the winter can often cause the intensity factor to double during the colder months. For wastewater, energy intensity is expressed as kWh of energy usage per kgal of wastewater treated. For gas, energy intensity is expressed as kWh of energy usage per MMcf of gas delivered to customers.
It is important to note is that Essential’s disclosure of energy intensity includes electricity consumption in addition to other forms of energy as outlined in the Energy Consumption section. We also disclose intensity metrics inclusive solely of electricity.
2022 | 2021 | 2020 | |
---|---|---|---|
Water (kWh/kgal) | 3.3 | 3.1 | 3.1 |
Wastewater (kWh/kgal) | 7.6 | 5.4 | 5.4 |
Gas (kWh/MMcf) | 1.8 | 2.0 | 1.9 |
Essential understands the urgency of the Paris Agreement and the UN Intergovernmental Panel on Climate Change’s science-based target of limiting the global temperature increase to well below 2 degrees Celsius. Addressing climate change requires a holistic management approach and tracking of our Scope 1, 2 and 3 greenhouse gas (GHG) emissions. Our executive and management teams understand there are two distinct elements of climate change: adaptation and mitigation. Essential is addressing both items and has implemented a robust management system to identify associated risks and opportunities.
Essential defines its climate-related impacts though a model which weighs likelihood, cost, magnitude of impact and time horizon. The process also allows for implications to be updated and easily re-evaluated annually. This reevaluation takes into consideration updates to climate models and the addition of new topics and implications as the businesses and business locations change. Essential manages climate change matters through significant board-level oversight of climate-related issues. It uses various channels and reporting paths to review the risks facing the organization and evaluate operational risk factors associated with climate change. At the management level, Essential’s ESG Oversight Committee, a group of about a dozen of the company’s senior leaders from across the organization and the CEO, meet at least once each quarter to discuss these topics. Various members of senior management have numerous additional opportunities each month to engage on climate change matters.
We provide much more information on Essential’s climate scenario analysis, board and executive oversight, risks, and opportunities in our CDP and TCFD reports.
In January of 2021, Essential announced a commitment to substantially reduce Scope 1 and 2 greenhouse gas emissions.
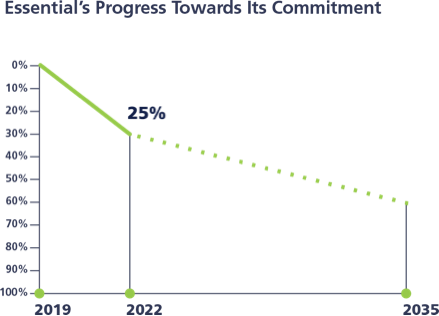
By 2035, Essential will reduce its emissions by 60% from its 2019 baseline, an uncommonly recent baseline within the utilities space.
This will be achieved by extensive gas pipeline replacement, renewable energy purchasing, accelerated methane leak detection and repair and various other planned initiatives that are highly feasible with proven technology. This science- based commitment is consistent with the rate of reduction necessary through 2035 to keep on track with the Paris Agreement, which aims to limit the global temperature increase to well below 2 degrees Celsius. All our utilities – gas, water and wastewater – across all our states will be contributing to this enterprise-wide target by building on important work and progress in recent years. Each Essential Utilities operation will individually contribute an approximate 60% Scope 1 and 2 emissions reduction.
Transparency is at the center of our ESG program and is a core value of our company. We will report on our progress toward this goal twice a year until we meet our target. This is a strong first step toward an ultimate aspiration of net zero emissions, which we acknowledge will only be possible with further technological and engineering innovation. While we’re optimistic and excited about the pace of technological advancement, this initial 60% Scope 1 and 2 emissions reduction will come from projects and initiatives we have already planned or put into place. These projects utilize existing and proven technology and methods and are real and tangible.
Essential’s current progress toward its greenhouse gas emissions reduction target is reported here and will be updated at least annually following the publication of this 2022 ESG Report.
Through 2022, Essential achieved a 25% reduction in its Scope 1 and 2 emissions versus its 2019 baseline, representing rapid and substantial progress toward its 60% target.
Water and Wastewater Operations
Procurement of nearly 100% renewable electricity for PA, NJ, OH and IL, plus about one-quarter renewable electricity procurement for TX
Gas Operations
Continual replacement of older gas main, which reduces fugitive methane leakage
Moving forward, Essential’s remaining progress toward its greenhouse gas emissions reduction commitment of 60% will be primarily driven by its gas operations. We expect a steady incremental reduction each year, reflective of continuing replacement of gas main.
Scope 1 Emissions- Direct GHG emissions occur from sources that are owned or controlled by our company, for example, emissions from combustion in owned or controlled boilers, furnaces and vehicles. Most notably, these include methane emissions from our gas pipelines.
Scope 2 Emissions- GHG emissions from the generation of purchased electricity consumed by Essential. Purchased electricity is defined as electricity that is purchased or otherwise brought into the organizational boundary of our company. Scope 2 emissions physically occur at the facility where electricity is generated.
2019 Baseline | 2035 Target | % Reduction | |
---|---|---|---|
Essential | 621,030 | 248,412 | 60.0% |
Gas distribution | 489,849 | 198,331 | 59.5% |
Water and wastewater | 131,181 | 50,081 | 61.8% |
Below are Essential’s 2022 GHG emissions by scope. For historical and more detailed disclosure, please refer to the Gas Operations and Water and Wastewater Operations subsections. Further, for the first time, Essential engaged a third party, Keramida, to conduct a limited assurance audit of 2022 Scope 1 and 2 greenhouse gas emissions in accordance with ISO 14064-3: 2019 Specification with guidance for the validation and verification of greenhouse gas assertion, which is an approved verification standard accepted by CDP. Keramida is a gold accredited service provider to CDP for verification services.
2022 | 2021 | 2020 | |
---|---|---|---|
Scope 1 emissions | 417,687 | 468,734 | 494,835 |
Scope 2 emissions (market-based) | 51,009 | 117,723 | 111,262 |
Scope 1+2 emissions (market-based) | 468,696 | 586,457 | 606,097 |
Scope 3 emissions | 9,020,426 | 8,659,255 | 8,653,218 |
Almost all of Essential’s Scope 1 emissions are emitted by our gas operations. Of this, the large majority of emissions relate to fugitive methane from pipeline leaks. As natural gas, which is primarily methane, travels through our network of underground pipes on its way to the customer, a very small portion of this volume leaks out and escapes into the atmosphere, often due to corrosion leaks, material defects or excavation damages. Our Long-Term Infrastructure Improvement Plan seeks to, over time, systematically replace older and more vulnerable sections of pipe made of leak-prone materials. Additionally, as is common across our industry and consistent with regulations, we utilize various leak detection technologies to proactively identify sources of fugitive methane and repair leaks as quickly as possible.
Our gas operations contribute a relatively very small amount of Essential’s Scope 2 emissions. Gas distribution is not an electricity-intensive operation. Even so, we continue to assess ways to increase energy efficiency and reduce consumption.
Materially all of Essential’s Scope 3 emissions are driven by our gas operations through carbon dioxide emitted by customers upon combustion of natural gas in their home or business. We continue to assess opportunities and initiatives to reduce these emissions and are aware that Scope 3 emissions are more challenging to address directly than Scope 1 and 2 emissions across industries. Like most of our peer gas utilities, we are examining exciting opportunities for alternative fuels, such as renewable natural gas or hydrogen, which also serve to reduce Scope 3 emissions.
2022 | 2021 | 2020 | |
---|---|---|---|
Scope 1 emissions | 401,363 | 452,740 | 478,684 |
Scope 2 emissions (market-based) | 5,199 | 4,502 | 3,156 |
Scope 1+2 emissions (market-based) | 406,562 | 457,242 | 481,840 |
Scope 3 emissions | 8,911,126 | 8,534,299 | 8,533,075 |
Note: Essential chooses to present Scope 2 emissions using the market-based method, as this approach incorporates the impact of various sourcing decisions, such as our procurement of renewable energy. In contrast, the location-based method reflects the average emissions intensity of grids on which energy consumption occurs. We wish to footnote Essential’s gas operations’ location-based Scope 2 emissions: 4,576 (2022), 4,332 (2021), 3,951 (2020).
Of Essential’s Scope 1 and 2 emissions, nearly 90% is driven by the gas distribution business. As such, almost all our future emissions reduction efforts will be driven by the company’s aggressive Long-Term Infrastructure Improvement Plan (LTIIP), which has a stated goal to replace 3,000 miles of bare steel and cast-iron pipe. In addition to the LTIIP, Essential is currently working on other initiatives to reduce emissions. This includes implementing a gathering system repair program, which allows for accelerated detection and leak repair; employing construction techniques that minimize methane emissions during replacement and repair activity; and using new equipment that captures gas used during construction and reinjects it into the system.
In 2013 we launched our LTIIP, an aggressive 20-year effort to replace and upgrade more than 3,000 miles of natural gas pipelines with new plastic pipelines that will not corrode. These lines are also flexible and can withstand the region’s seasonal freeze and thaw cycle. To date, Essential has replaced more than 800 miles of pipeline, and we anticipate completing this project by 2033. Pipelines selected for replacement are based on operating history and location. We assess about 450,000 segments of pipe and assign a relative risk ranking based on probability of failure and consequence of failure to help us prioritize action.
LTIIP is currently the most significant of our Scope 1 and 2 greenhouse gas emissions reduction efforts and is an excellent example of how operational efficiency, reliability, safety and mitigation of climate change can mutually reinforce each other for the benefit of all our stakeholders.
Due to the on-system gas production in our service territory, Essential has a considerable gathering line system that is used to transport natural gas from the wellhead to the distribution system. A separate replacement plan addresses the replacement of gathering assets. The original four-year plan began in 2017 and focused on removal or replacement of over 135 miles of gathering line. As of year-end 2022, Essential’s gas utility extended the plan’s efforts and has removed or replaced a total of 184 miles of gathering lines from the system.
As a result of main replacement activities, Essential has reduced identified leaks per mile of utility pipe surveyed (inclusive of distribution and gathering pipe but excludes that of the Goodwin-Tombaugh system) by 23%, from 1.72 in 2015 to 1.33 in 2022. This metric has remained consistent over the past three years. We are surveying gathering pipe more often and have chosen to normalize this by disclosing leaks in relation to miles of pipe we surveyed in the given year.
2022 | 2021 | 2020 | |
---|---|---|---|
Identified Leaks Per Mile of Pipe Surveyed | 1.33 | 1.33 | 1.33 |
Essential has partnered with WATT Fuel Cell Corp., a company based in Mt. Pleasant Township, Pennsylvania, to launch a pilot program aimed at offering the manufacturer’s Solid Oxide Fuel Cell (SOFC) system throughout our gas service territory.
WATT developed a hybrid SOFC power management system that creates small-scale power, 500W to 1.5kW, from natural gas or hydrogen. Through an electrochemical reaction, the fuel cell transforms the energy in gas or hydrogen to electricity with low direct emissions.
The company already sells fuel cells using propane for RVs and small watercrafts and is scaling its operations through this partnership with Essential’s natural gas utility. To do this, WATT has developed a proprietary manufacturing technique that creates an entire fuel cell tube using an additive manufacturing process. Additive manufacturing, or 3-D printing, uses plastics, resins and metals to print a product by adding layers, different from traditional manufacturing methods that cuts out raw material to create parts.
Renewable natural gas (RNG), or biomethane, comes from the anaerobic digestion of organic matter, such as manure, agricultural waste, food waste or landfill. The carbon dioxide emissions produced when RNG is used as a fuel are substantially or completely offset by methane captured during the formation of the source feeds. RNG combines low or zero full-cycle carbon emissions with the high energy density and transportability of natural gas. After suitable treatment, the RNG can be injected directly into the natural gas pipeline network, allowing it to use the extensive existing natural gas infrastructure when installed base of customer natural gas equipment. RNG has the potential to reduce Scope 3 emissions when the utility owns the associated renewable credits.
Currently, Essential interconnects with six landfills that deliver RNG gas directly into our pipeline system. In 2022, this measured to more than 1.4 Bcf, or about 1% of our total gas throughput. About 56% of this RNG is transported by Essential into an interstate pipeline or to a third-party pool operator. The remaining 44% is directly purchased by Essential, blended with our traditional natural gas supply and delivered directly to our customers.
Essential does not currently purchase renewable credits associated with the physical supply of RNG due largely to least-cost gas procurement guidelines set by regulators. Thus, we cannot apply this emissions reduction to our greenhouse gas inventory. However, we believe we play a constructive and positive role in the development and function of the RNG market across our footprint by facilitating trade and transport of this environmentally friendly energy source. Essential is also working with other companies on developing potential additional RNG interconnections in our service territory, and we look forward to expanding the number of partnerships with producers in the region.
Hydrogen is a promising alternative fuel that may be efficiently blended with natural gas in energy supply to customers in future years. It can be used as a feedstock, a fuel, an energy carrier or an energy storage medium. Hydrogen emits no end-use carbon emissions and creates minimal air pollution. There are several “types” of hydrogen, classified based on their production method and resulting lifecycle emissions profile. The gas industry is currently examining the feasibility to blend hydrogen within pipelines at scale and examining how this would be efficiently produced at necessary volumes.
Hydrogen-blending targets for existing natural gas infrastructure do not exist today, but there is increasing demand for the alternative fuel. The U.S. National Renewable Energy Laboratory and other researchers have reported that there are current projects across the world that blend up to 20% hydrogen without requiring end-use customers to upgrade boilers and burners.
Essential and the University of Pittsburgh’s Swanson School of Engineering have entered a partnership to explore the use of hydrogen as a future energy source. Together, the organizations will study the potential of safely and securely transporting hydrogen through Essential’s natural gas delivery systems. The partnership will consist of two phases. The first phase will conduct benchmarking and research focusing on the existing infrastructure, concentrating on technical issues involved with using natural gas pipelines to transport hydrogen or a hydrogen and natural gas blend. The second phase will be the implementation of a pilot project that will test the injection of hydrogen blend in real-world applications, including pipeline material degradation and the impact of hydrogen blend on end-users’ natural gas fueled equipment.
Additionally, in both 2022 and 2023, Essential co-hosted energy industry leaders, investors, innovators, regulators and top practitioners at the H2 Conference in Pittsburgh. This event has positioned Appalachia and the Pittsburgh region as leaders in global energy innovation. Discussion topics and presentations have revolved around the region’s role in large-scale hydrogen hubs being proposed by the U.S. Department of Energy. Additional central themes include the latest research, progress and best practices in commercializing this technology.
At Essential, we strongly support UN Sustainable Development Goal 17, which calls for partnership. We work closely with various academic, nonprofit and industry organizations to discuss and collaborate on opportunities to innovate on energy and greenhouse gas emissions reductions.
Essential is a founding member of the Pennsylvania Department of Environmental Protection’s Southwestern Pennsylvania Energy Efficiency Roundtable. This group is a consortium of energy efficiency stakeholders, and its primary mission is to help business and industry in Southwestern Pennsylvania reduce energy costs through improved energy management, energy efficiency and cutting-edge technology.
Essential is a founding sponsor of the University of Pittsburgh’s Center for Sustainable Business at the Joseph M. Katz Graduate School of Business. The Center’s mission is to maximize the value of investments in sustainable business strategies for all stakeholders.
Essential and the University of Pittsburgh’s Swanson School of Engineering have entered a partnership to explore the use of hydrogen as a future energy source. Together, the organizations will study the potential of safely and securely transporting hydrogen through Essential’s natural gas delivery systems.
Essential is a long-time member of the Pittsburgh Region Clean Cities (PRCC). PRCC advances the energy, economic and environmental security of the United States by supporting local actions to reduce petroleum use in transportation.
Essential has been a sponsor of the Energy Innovation Center (EIC) for several years. The Energy Innovation Center is a Pittsburgh based, not-for-profit organization with a mission to engage corporate and community leaders, align workforce development and education, develop and demonstrate technology and incubate businesses to support emerging clean and sustainable energy markets. Essential is a key stakeholder and has been instrumental in the adoption of two microturbine-CHP systems that provide the LEED Platinum Certified facility with resilient and efficient heat and power.
Essential works to continuously educate our customers on conservation and energy efficiency opportunities. Some of our key customer conservation messages for Peoples customers include:
By using a variety of channels, our goal is to establish multiple customer touchpoints for these key conservation messages. We use tools like digital marketing, traditional advertising opportunities, bill inserts, and community partnership activation to share this information and drive customers to our website as a central education hub. Some recent examples of how we promoted these messages to Peoples customers include:
Scope 2 emissions are most significant for Essential’s water and wastewater operations. It takes considerable electrical energy to treat water and wastewater as well as to pump water through our distribution network of pipes. Year-to-year fluctuations in energy use may be driven by weather events and changes in customer demand for water. We predicate our Scope 2 emissions reduction on three primary strategies, among others. First, we have made strides in making our operations as energy efficient as possible (see
Finally, and most notably, we have made headway in using as much renewable electricity as we can while balancing affordability for customers.
Notably in 2022, our water and wastewater operations in Pennsylvania, Ohio, Illinois and New Jersey switched to nearly 100% renewable electricity procurement.
Our Texas operations has also recently increased renewable electricity procurement to about 25%. This major uptick in renewable electricity consumption has dramatically diminished Essential’s Scope 2 emissions in short order.
Scope 1 emissions have historically been a smaller component of Essential’s water operations’ emissions and are primarily driven by gas consumption for heating facilities and powering vehicles and some equipment.
The impact of indirect emissions, Scope 3, is also notable. Tracking and reducing those emissions comprise an important component of our overall carbon reduction strategy.
Pipe replacement activities, which are necessary to address aging infrastructure, are the largest contributor to Scope 3 emissions. The methods and materials used today extend the serviceable usefulness up to 100 years compared to piping installed just 30 years ago, which translates to reduced frequency of pipe replacement over time. Pipe replacement activities also offer an ancillary benefit to our Scope 2 emissions as better and newer piping means less lost water through leaks and main breaks, resulting in a reduction of water that needs to be produced.
Although chemicals are required for water safety and quality, their purchase is Essential’s second largest source of Scope 3 emissions. We acknowledge that warmer water temperatures brought on by climate change will require Essential to use more chemicals to produce safe drinking water. By tracking GHG impacts from chemical purchases, we are able to better understand the impact of climate change on treatment operations.
Additionally, the upstream impacts and energy-related activities of the fuel we need to generate electricity significantly contribute to our Scope 3 emissions. By reducing the amount of electricity consumed and increasing our use of renewables, we can reduce this impact. Other Scope 3 contributors are not as material, but we maintain awareness of these items nonetheless.
2022 | 2021 | 2020 | |
---|---|---|---|
Scope 1 emissions | 16,234 | 15,994 | 16,057 |
Scope 2 emissions (market-based) | 45,810 | 113,221 | 115,124 |
Total Scope 1+2 emissions (market-based) | 62,134 | 129,215 | 131,181 |
Total Scope 3 emissions | 121,190 | 124,596 | 110,675 |
Note: Essential chooses to present Scope 2 emissions using the market-based method, as this approach incorporates the impact of various sourcing decisions, such as our procurement of renewable energy. In contrast, the location-based method reflects the average emissions intensity of grids on which energy consumption occurs. We wish to footnote Essential’s location-based Scope 2 emissions for its water and wastewater business as follows: 121,190 (2022), 110,970 (2021) and 120,776 (2020). The overall reduction of our location-based emissions is largely a reflection of the energy grid’s mix transitioning away from coal to natural gas and renewables and we expect this trend to continue.
Metric Tons CO2e | Percentage of Total | |
---|---|---|
Capital goods | 35,404 | 32.4% |
Purchased goods and services | 37,359 | 34.2% |
Fuel-and-energy-related activities (not included in scopes 1 or 2) | 28,319 | 25.9% |
Other (Upstream) | 5,710 | 5.2% |
Waste generated in operations | 826 | 0.8% |
Employee Commuting | 1,682 | 1.5% |
Total Scope 3 emissions | 109,300 | 100% |
Reducing our fleet footprint is an important and effective aspect of our GHG emissions reduction efforts.
Essential’s gas, water and wastewater utilities have a diverse geographical footprint across ten states, covering thousands of square miles of service area and almost 2,000 individual locations. Many of the locations require visits from employees daily or several times a week, resulting in frequent vehicle usage.
Fleet currently accounts for about 7% of Essential’s Scope 1 and 2 emissions.
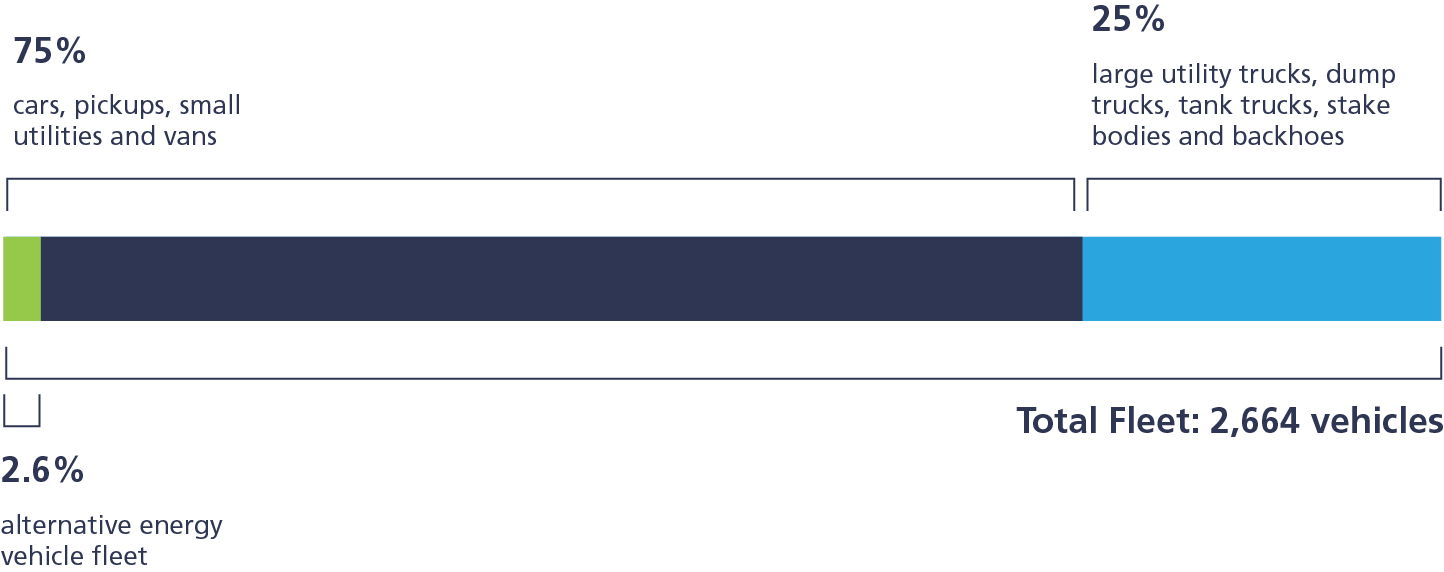
There are 2,664 vehicles in Essential’s fleet. Of these vehicles, 2,009 units (75%) are cars, pickups, small utilities and vans (our light-duty fleet). The remaining 655 units (25%) consist of our large utility trucks, dump trucks, tank trucks, stake bodies and backhoes. We currently have 69 vehicles in our alternative energy vehicle fleet, accounting for 2.6% of our total fleet. These alternative vehicles include five electric and 64 compressed natural gas (CNG) vehicles. Since our strategic partner, General Motors, has put an emphasis on the light-duty market, we will first focus on expanding the electrification of the light-duty segment of our fleet.
- Stephenson, P.J. and Carbone, G. (2021). Guidelines for planning and monitoring corporate biodiversity performance. Gland, Switzerland: IUCN
As a water, wastewater, and gas utility, biodiversity and ecosystem health are critical in the sustainability of our organization and fidelity to our mission. While climate change and biodiversity are strongly linked, there are critical distinctions and independent dynamics between them that play a role and have different consequences. However, in each case, Essential acknowledges and is optimistic about the positive impacts we can have as an experienced environmental steward endowed with trust by our local community.
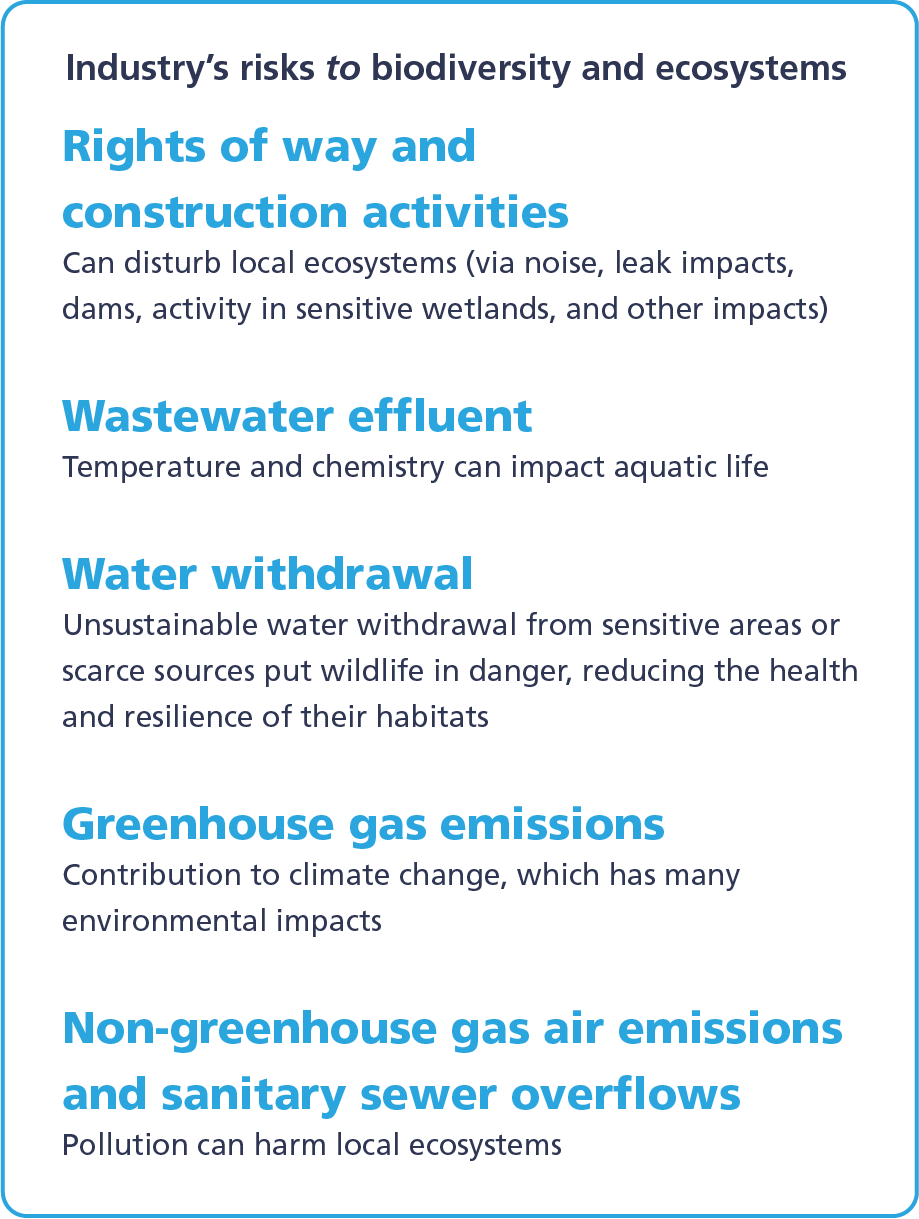
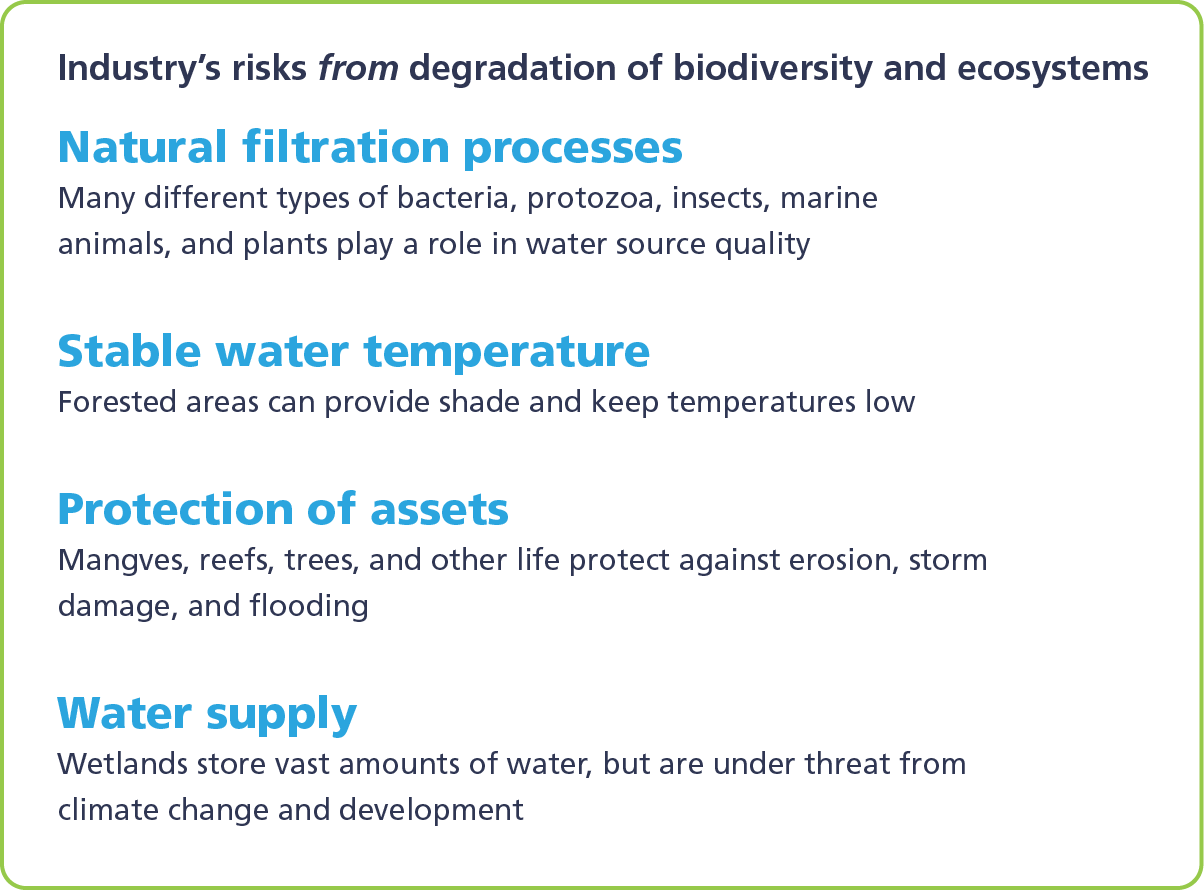
When we consider biodiversity and ecosystem impacts material to our industry, it is important to note their bidirectional nature: there are impacts from our business operations and to the environment as well as from the environment and to our business operations. As frameworks for corporate reporting in this area continue to develop, Essential will continue to analyze and consider risks and opportunities that are particularly material. For now, we note our awareness of general risks to and from operations typical of our industry and not Essential specifically:
In line with this understanding, Essential’s board has recently approved an expansion of the company’s Sustainability and Environmental Policy. While these stated commitments reflect past efforts and guiding principles we have held for generations, we believe memorializing these in a formal policy offers deeper assurance to our stakeholders and promotes greater awareness for our team.
We strive to:
Essential takes numerous actions across its footprint to promote biodiversity and ecosystem health. As a highly regulated utility, many of these are required or prescribed by authorities. For example, in Pennsylvania, we must abide by Pennsylvania Natural Diversity Inventory (PNDI) requirements. Essential is currently undertaking a Geographic Information Systems-aided biodiversity assessment of our 10,000 acres under our protection across our footprint. Understanding and mapping the richness of life on our lands is a necessary precursor to broader actions or additional enterprise-level commitments we may make moving forward. Further, our Earth Day volunteerism activities across the company, detailed here, educate employees on the vital role we can all play in conservation.
Essential has expanded its reporting and policy language for biodiversity and ecosystems with the awareness that there are international efforts currently underway to develop common frameworks and raise the level of ambition in the business community around these principles. We welcome these proceedings and will be assessing these, particularly the recommendations of the Task Force on Nature-Related Financial Disclosures (TNFD), in the future for possible alignment. We also continue to assess new opportunities within our operations to promote biodiversity and strengthen our current initiatives in this area.
While we believe many of our activities and operations promote positive ecological impacts, there are some instances and circumstances in which there arises a conflict in need of a solution. In these cases, we strive to act in accordance with a mitigation hierarchy:
Measures taken to avoid creating impacts from the outset (including direct, indirect and cumulative impacts), such as careful spatial or temporal placement of elements of infrastructure, to completely avoid impacts on certain components of biodiversity.
Measures taken to reduce the duration, intensity and/or extent of impacts (including direct, indirect and cumulative impacts) that cannot be completely avoided, as far as is practically feasible.
Measures taken to rehabilitate degraded ecosystems or restore cleared ecosystems following exposure to impacts that cannot be completely avoided or minimized.
Measures taken to compensate for any significant residual, adverse impacts that cannot be avoided, minimized and/or rehabilitated or restored, in order to achieve no net loss or preferably a net gain of biodiversity. Offsets can take the form of positive management interventions such as restoration of degraded habitat, arrested degradation or averted risk, or protecting areas where there is imminent or projected loss of biodiversity.
Measures to recompense, make good or pay damages for loss of biodiversity caused by a project that can fall short of achieving no net loss or a net gain.
This 2023 ESG Reporting Update provides our continued progress towards our ESG programs and strategy and covers metrics for the 2023 fiscal year. For more information about Essential ESG practices and initiatives, please see our 2022 ESG Report.
Measuring Progress Towards Our Targets 2023 SASB/ESG Metrics Index 2023 TCFD REPORT 2024 CDP Response 2023 AGA Sustainability Template